Histographic Segmentation
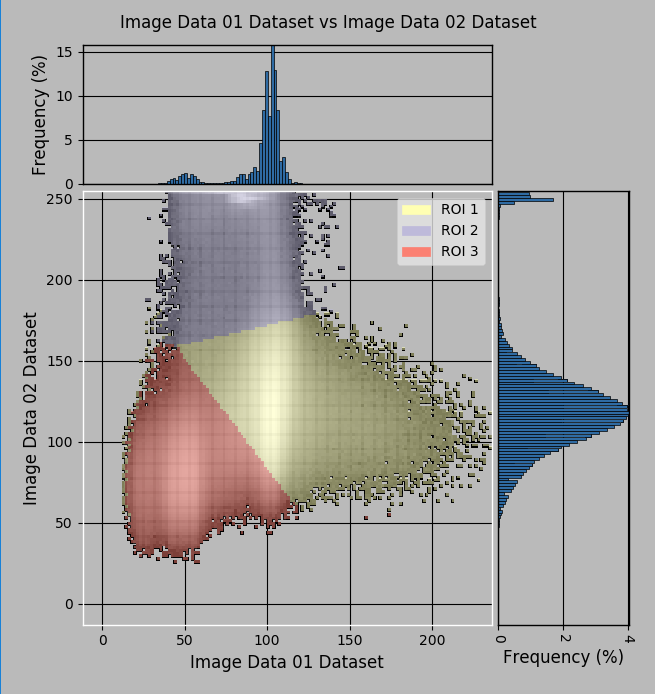
Histographic segmentation offers the opportunity to interact with multiple datasets mapped on a two-dimensional histogram and to distinguish features of interest and then select clustered data values to create regions of interest. With this tool, you can quickly segment a dataset by selecting clustered data values, which will be propagated to all data points that meet the selection criteria. Regions of interest created in this manner can either be exported or expanded through a Watershed algorithm to fully segment the selected dataset.
A number of preliminary steps may be required to optimize histographic segmentation.
- Prepare your datasets (see Image Filters and Settings for information about applying filters and other operations).
- Create a mask that defines the subset of the data that you intend to plot.
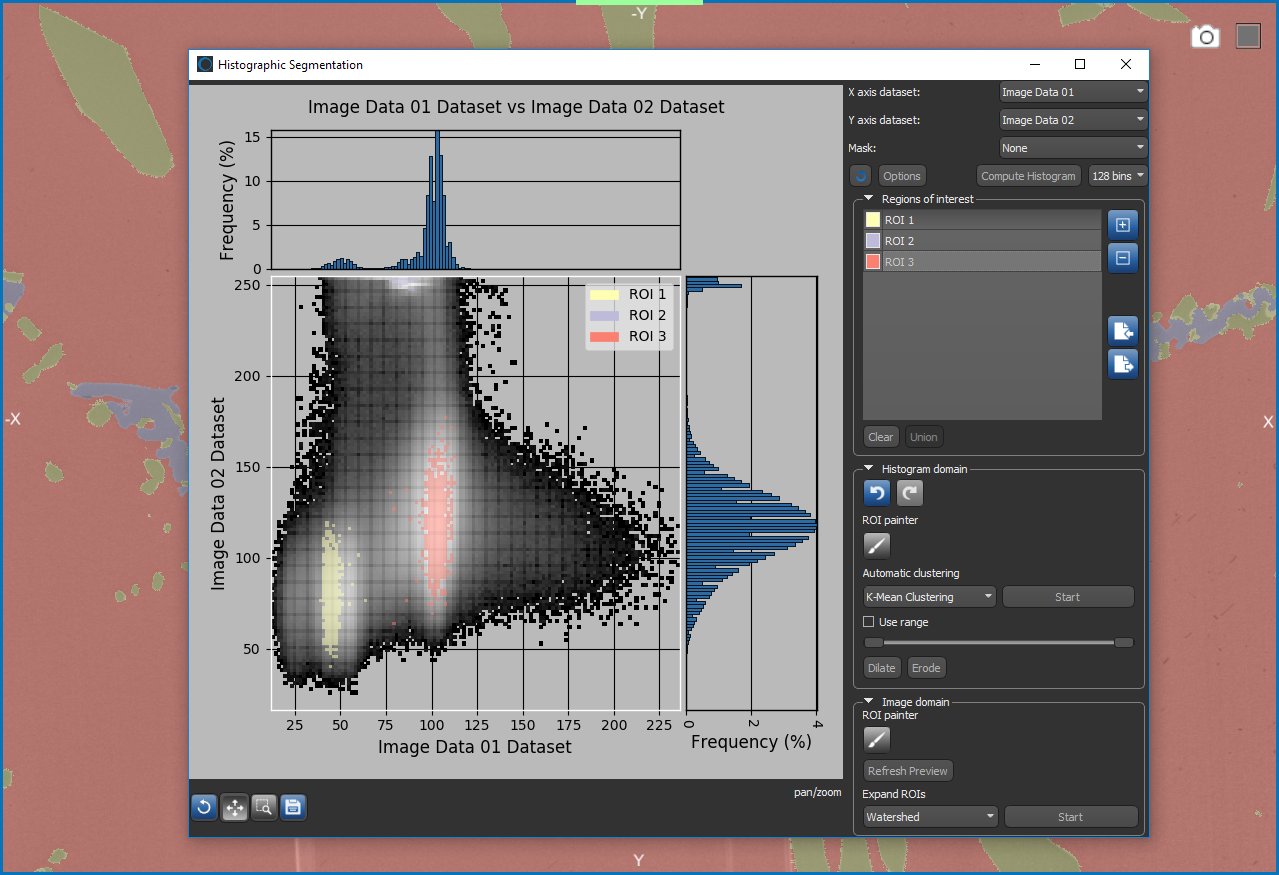
Histographic Segmentation dialog
For plotting in the Histographic Segmentation dialog, selected datasets must of the same size and type, but can be from different modalities. In addition, the Sobel of dataset selected for X axis will be available automatically for plotting on the Y axis. You can also select a mask to restrict processing to a subset of the data.
- Choose Tools > Histographic Segmentation on the menu bar.
The Histographic Segmentation dialog appears.
- Choose the dataset that you want to plot on the X axis in the X axis dataset drop-down menu.
- Choose the dataset that you want to plot on the Y axis in the Y axis Y dataset drop-down menu.
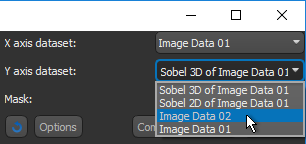
NOTE The 2D and 3D implementation of Sobel of the selected dataset is available by default for plotting on the Y axis.
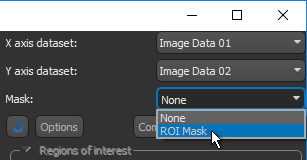
- Choose a mask in the Mask drop-down menu, if available and if required.
If a mask is selected, only data points within the mask will be plotted.
NOTE Click the Refresh
 button to update the list of available datasets and masks, if you added new data to the Data Properties and Settings panel while you were working in the Histographic Segmentation context.
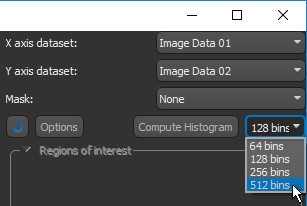
 - Select the required number of bins — 64, 128, 256, or 512 — for the histogram, if required.
- Click the Compute Histogram button. The datasets are plotted in the dialog.
- Adjust the display of the histogram, if required.
You can change the color map applied to the histogram, as well as display contour lines and adjust the opacity of the ROIs (see Modifying Histograms).
- Create the required number of regions of interest (see Creating Regions of Interest).
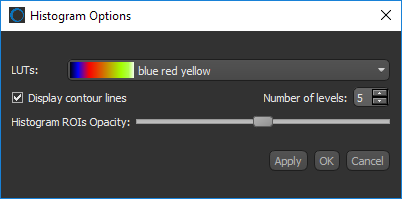
You can select an LUT to change the appearance of the histogram, as well as display contour lines and change the opacity of regions of interest. Click the Options button in the Histographic Segmentation dialog to open the Histogram Options dialog shown below.
Histogram Options dialog
|
|
Description |
|---|---|
|
LUTs |
Determines the color map applied to the histogram.
|
|
Display contour lines |
If selected, contour lines surrounding intensity ranges will be visible on the histogram. Number of levels… Determines the number of contour lines. |
|
Histogram ROIs opacity |
Determines the opacity of ROIs that appear on the histogram, from transparent to completely opaque. |
- Click the Options button in the Histographic Segmentation dialog.
The Histogram Options dialog appears.
- Select the required options, as described in the above table.
- Do one of the following:
- Click Apply to preview your changes.
- Click OK to apply your changes and close the dialog.
- Click Cancel to discard all changes and close the dialog.
The plot tools available in the Histographic Segmentation dialog let you pan and zoom the figure, as well as edit the titles and attributes for each axis. You can also save the figure to a number of different file formats.
|
|
Icon | Description |
|---|---|---|
|
Reset |
|
Resets the original view of the figure. |
|
Pan |
|
Pans or zooms the figure as described below. Pan… Click with the left mouse button and then drag to pan the figure. Zoom on the Y axis… Click with the right mouse button and then drag up and down to Zoom in and Zoom out on the Y axis. Zoom on the X axis… Click with the right mouse button and then drag left and right to Zoom in and Zoom out on the X axis. |
|
Zoom |
|
Zooms to a selected rectangle, which can be defined by dragging your cursor over the area that you want to zoom. |
|
Save |
|
Saves the figure as a bitmap image, vector graphic, or in the PDF file format. The figure can also be saved as raw data or PGF code for LaTeX. Standard image files (*.jpeg, *.jpg, *.png, *.tif, *.tiff extensions)… Saves the figure as a bitmap image in the screen resolution. Postscript files (*.eps, *.ps extensions)… Saves the figure as an encapsulated postscript or postscript file. These types of files have a selectable resolution and provide high-quality graphics for publications. PGF code for LaTeX (.pgf extension)… Saves the figure in the Portable Graphics file format. Raw RGBA bitmap (*.raw, *.rgba extensions)… Saves the figure as a raw bitmap image file, in which the file contains only a list of pixel colors and nothing else. Scalable vector graphics (*.svg, *.svgz extensions)… Saves the figure in an XML-based vector image format. The SVG specification is an open standard developed by the World Wide Web Consortium (W3C). SVG images and their behaviors are defined in XML text files. Portable document format (*.pdf extension)… Saves the figure in the Adobe PDF file format. |
You can create a region of interest for each group of voxels that share the same characteristics and then choose to work either in the Histogram domain, in which you draw on the histogram, or in the Image domain, in which you draw on an image display. You can also choose to work in a combination of both domains.
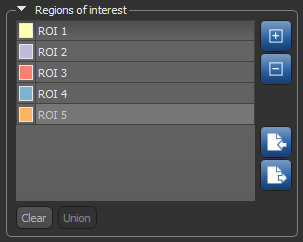
Regions of interest box
|
|
Icon |
Description |
|---|---|---|
|
Add |
|
Adds a new region of interest to the list. |
|
Remove |
|
Removes the selected region of interest. |
|
Import |
|
Imports an existing region of interest (see How to Import an Object). NOTE You can only import a region of interest that has the same size and shape as the datasets with which you are working. |
|
Export |
|
Exports an existing region of interest (see Exporting Regions of Interest). |
|
Clear |
|
Removes all labeled voxels from the selected region of interest. |
|
Union |
|
Creates a new region of interest that includes all labeled voxels in the selected regions of interest. NOTE The regions of interest selected for a union will not contain any labeled voxels after the operation is complete. |
- Click the Create New ROI
 button in the Regions of interest box.
 - Add data points to the selected region of interest with the Brush
 tool.
tool.
You can choose to work in the Histogram or Image domain or both (see Working in the Histogram or Image Domain).
- Add the required data points to the selected region of interest as follows:
- Use the scroll wheel on your mouse to change the brush size, if required.
- Hold-down Left Ctrl (or your configured key) to add data points to the selected region of interest.
- Hold down Left Shift (or your configured key) to remove data points from the selected region of interest.
NOTE You can change slices while you work. Click the Refresh Preview button in the Image domain box to update the view of a new slice.
- Create additional regions of interest, if required.
- Export and and/or expand the regions of interest that you created (see Exporting Regions of Interest and Expanding Regions of Interest).
You can choose to work in the Histogram or Image domain or a combination of both. These domains are linked so that whenever you draw on the histogram the current image is updated and vice versa.
The selection you make on an image slice or in the histogram will be propagated to all the voxels in the dataset that meet the selection criteria.
- Click the Create New ROI button in the Regions of interest box.
- Add data points to the selected region of interest with the Brush tool.
You can choose to work in the Histogram or Image domain or both (see Working in the Histogram or Image Domain).
- Add the required data points to the selected region of interest as follows:
- Use the scroll wheel on your mouse to change the brush size, if required.
- Hold-down Left Ctrl (or your configured key) to add data points to the selected region of interest.
- Hold down Left Shift (or your configured key) to remove data points from the selected region of interest.
NOTE You can change slices while you work. Click the Refresh Preview button in the Image domain box to update the view of a new slice.
- Create additional regions of interest, if required.
- Export and and/or expand the regions of interest that you created (see Exporting Regions of Interest and Expanding Regions of Interest).
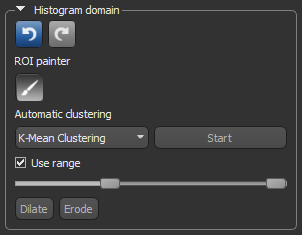
Options for working in the Histogram domain are available in the Histogram domain box, shown below.
Histogram domain box
|
|
Icon |
Description |
|---|---|---|
|
Undo |
|
Undoes the last operation that you performed in the Histogram or Image domain. NOTE Some operations or actions cannot be undone, such as reinstating a removed region of interest or exporting an ROI. If you can't undo an operation, the Undo button will remain inactive. |
|
Redo |
|
Redoes the last operation that was undone. |
|
Brush |
|
The Brush tool lets you make selections on the histogram and is dependent on the Use range setting.
NOTE Whenever you draw in the histogram, the results are updated in the previews automatically. |
|
Automatic clustering |
|
Creates the number of specified regions of interest through a K-Mean or Mean Shift clustering algorithm. You should note that the Use range option can be selected for automatic clustering. Results of automatic clustering
[1] http://scikit-learn.org/stable/modules/clustering.html#k-means [2] http://scikit-learn.org/stable/modules/clustering.html#mean-shift |
|
Use range |
|
You can use this feature to define a domain of intensity, which is highlighted a constant color. Any voxel with a value outside the defined range will not be selectable with any of the Brush tools.
|
|
Dilate |
|
Expands the region of interest. |
|
Erode |
|
Shrinks the region of interest |
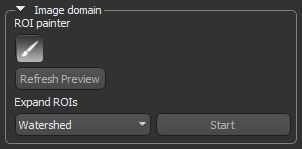
Options for working in the Image domain are available in the Image domain box, shown below.
Image domain box
|
|
Icon |
Description |
|---|---|---|
|
Brush |
|
The Brush tool lets you make selections on a preview image and is dependent on the Use range setting.
NOTE You can change slices while you work. Click the Refresh Preview button to update the view of a new slice. |
|
Refresh Preview |
|
Updates the view of a new slice in the preview window. |
|
Expand ROIs |
|
Creates a series of ROIs that fully segment the selected dataset (see Expanding Regions of Interest). |
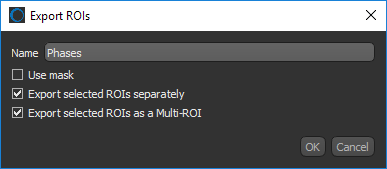
You can choose to export regions of interest as ROIs or as a multi-ROI. The new regions of interest or multi-ROI will be added to the Data Properties and Settings panel.
You can also export regions of interest expanded with a watershed algorithm( see Expanding Regions of Interest).
Export ROIs dialog
- Check your segmentation on representative slices within the dataset with which you are working and then make any necessary adjustments, recommended.
After you scroll through the dataset, you must click the Refresh Preview button to update the preview.
- Click the Export Selected ROI
 button.
 - Enter a name for the selected data in the Export ROIs dialog, optional.
If a name is not entered, then the names assigned in the Histographic Segmentation dialog will be retained with the designation Hist. Seg. appended at the beginning.
If a name is entered, the new name plus the names assigned in the Histographic Segmentation dialog will be added to the new data.
- Select the required export options as indicated below.
- Choose Export selected ROIs one-by-one to export each selected region of interest as a new ROI.
- Choose Export selected ROIs as a multi-ROI to export all selected regions of interest as a single multi-ROI.
- Click the OK button.
The exported region(s) of interest appear in the Data Properties and Settings panel (see ROI Properties and Settings and Multi-ROI Properties and Settings for information about working with regions of interest and multi-ROIs).
The result of expanding regions of interest is a series of ROIs that fully segment the selected dataset.
The watershed algorithm, whose name comes from an analogy with hydrology. has many applications in image processing, such as automated object segmentation or separation. Starting from user-defined markers, the watershed algorithm treats voxel values as a local topography (elevation). The algorithm then floods basins from the markers, until basins attributed to different markers meet on watershed lines that correspond to the desired segmentation.
This algorithm depends on the following inputs:
- Labeled regions that are used as seed areas for the flooding. At the end of the process there will be as many separated objects as markers labeled differently.
- An image that plays the role of the landscape height field or altitude map that controls the flood progression and finally the location of watershed separations.
- A distance map that provides the priority map input for a watershed process.
Different applications can be achieved by carefully choosing the inputs.
|
|
Description |
|---|---|
|
Landscape |
The dataset that will provide the local topography for the watershed algorithm. |
|
Use mask |
If selected, the mask used to compute the histogram will be applied to the watershed calculation. |
- Add the required regions of interest that define the inputs used for the expansion.
NOTE You must create a least two regions of interest to use the watershed expansion scheme.
- Check your segmentation on representative slices within the dataset and make any necessary adjustments, recommended.
After you scroll through the dataset, you must click the Refresh Preview button to update the preview.
- Select the required algorithm in the Expand ROIs drop-down list and then click the Start button.
- Select the dataset that will provide the landscape for the segmentation in the Watershed dialog. The Sobel of the selected dataset is recommended, if available.
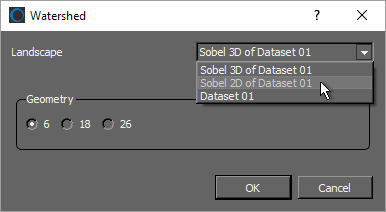
- Select the Use mask option, if you want to limit the segmentation to only data points within the previously selected mask.
- Select the required geometry — 6, 18, or 26 — in the Geometry box.
-
Click the OK button.
New regions of interest generated from the seed points are added to the Data Properties and Settings panel (see ROI Properties and Settings).
A number of configured actions and keyboard shortcuts are available for working with the Histographic Segmentation tools. The default settings for these actions are listed in the following table.
|
Action |
State |
Key |
Mouse |
|---|---|---|---|
|
Add on histogram in Histographic Segmentation |
Paint ROI on histogram |
Left Ctrl |
Left mouse |
|
Increase brush size in Histographic Segmentation in Add mode |
Add to ROI on view |
Left Ctrl |
Mouse wheel up |
|
Increase brush size in Histographic Segmentation in Remove mode |
Remove from ROI on view |
Left Shift |
Mouse wheel up |
|
Remove from histogram in Histographic Segmentation |
Paint ROI on histogram |
Left Shift |
Left mouse |
|
Decrease brush size in Histographic Segmentation in Add mode |
Add to ROI on view |
Left Ctrl |
Mouse wheel down |
|
Decrease brush size in Histographic Segmentation in Remove mode |
Remove from ROI on view |
Left Shift |
Mouse wheel down |
|
Add using brush in Histographic Segmentation |
Add to ROI on view |
Left Ctrl |
Left mouse |
|
Remove using brush in Histographic Segmentation |
Remove from ROI on view |
Left Shift |
Left mouse |
|
Switch to Add using brush in Histographic Segmentation |
Paint ROI on view |
Left Ctrl |
|
|
Switch to Remove using brush in Histographic Segmentation |
Paint ROI on view |
Left Shift |
|